 Documentation
Packet List
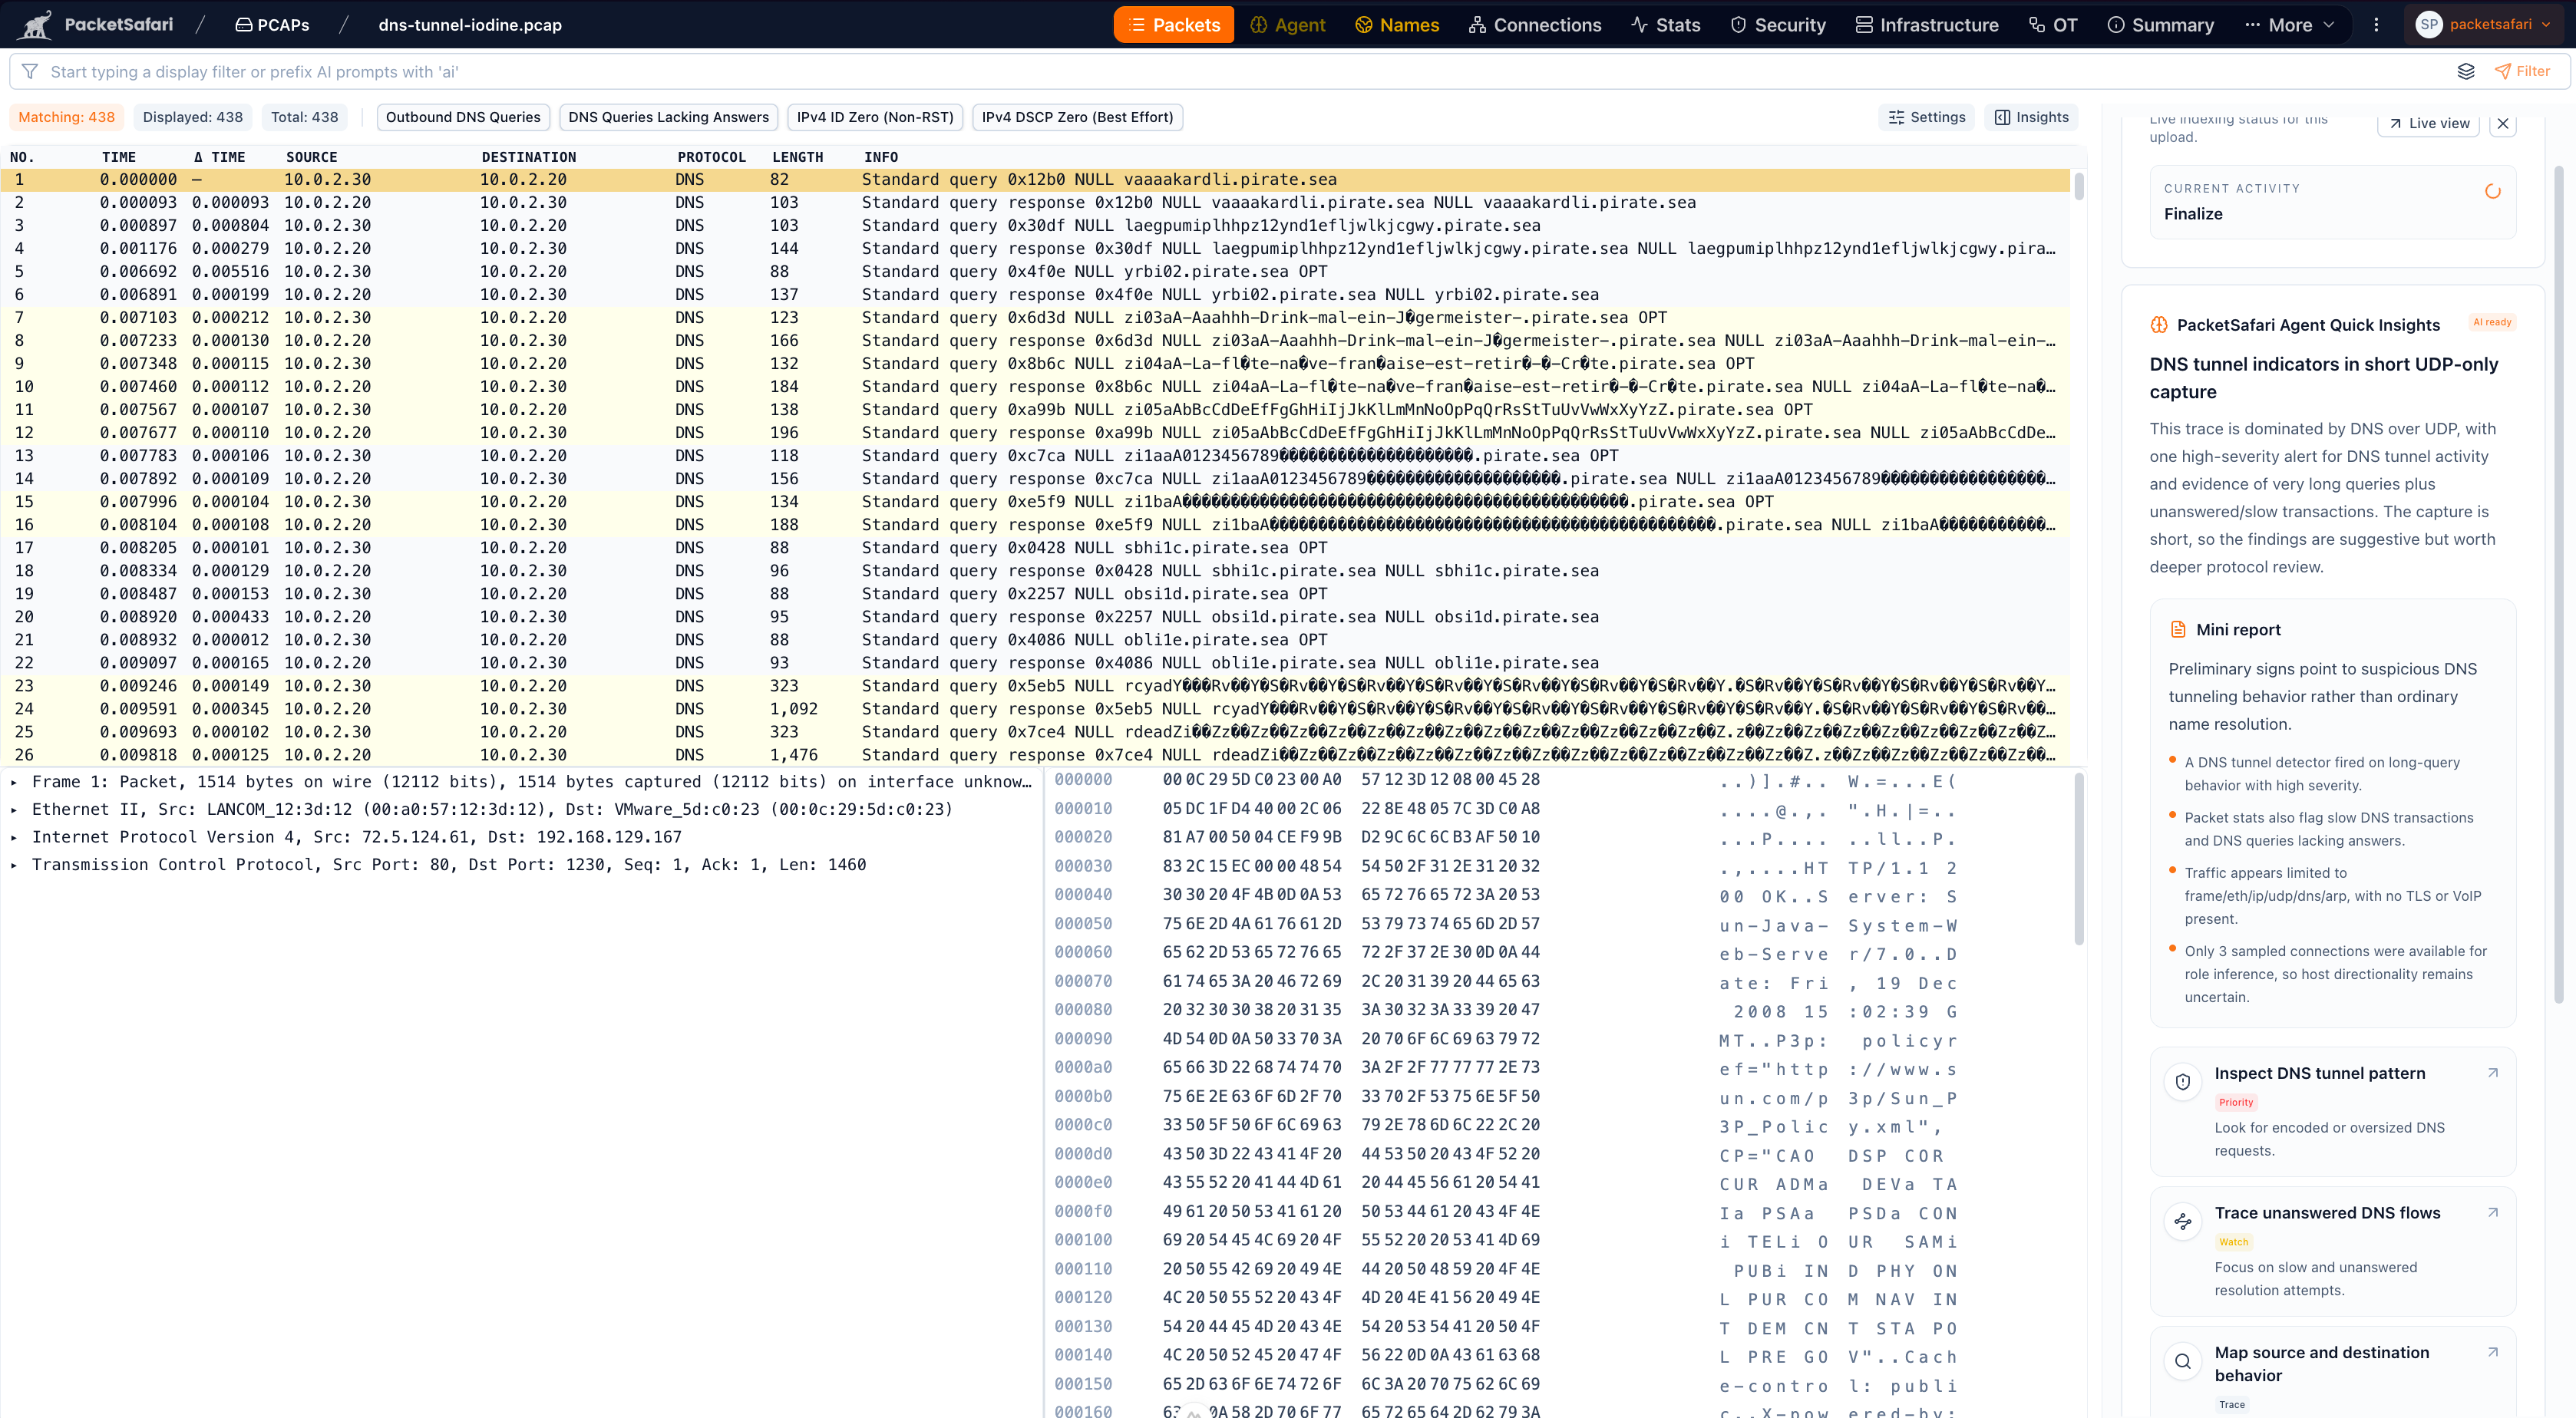
The packet list is the heart of the analyzer. It supports infinite scrolling, keyboard navigation, hotspot highlighting, and quick links into decode/hex or follow stream views.
Filtering packets
Use the filter bar above the table. Autocompletion and field suggestions come from the capture data PacketSafari has already prepared during background processing.
The packet list supports Wireshark-style filtering inside an opened capture even while broader library processing is still catching up.
- Protocol:
http,tcp,dns - IP/Port:
ip.addr == 192.168.0.1,tcp.port == 443,udp.port === 53 - Time:
frame.time >= "2024-03-01 10:00:00" && frame.time <= "2024-03-01 10:05:00" - Length:
frame.len > 1000 - MAC/VLAN:
eth.src == 00:11:22:33:44:55,vlan.id == 100 - Flags:
tcp.flags.syn == 1 && tcp.flags.ack == 0 - HTTP/TLS/DNS:
http.response.code == 404,tls.handshake.version == 0x0304,dns.flags.response == 1 - Payload contains:
http contains "password"(decrypt first if traffic is encrypted) - Subnets:
ip.addr === 192.168.1.0/24
Combine expressions with && / || and negate with !. Filters from the PCAP library search carry over when you open matching packets.
Navigation and deep links
- Copy the permalink icon to share a filtered view.
- Jump to a specific frame via Go to frame or reset the time reference from the right-click menu.
- Use Show matches from the PCAP list to open only the packets that matched your library search.
Packet hotspots
PacketSafari surfaces packet hotspots when a finding can be tied to a bounded evidence range. A hotspot includes a severity, short reason, frame range, and Go to action. When the hotspot is active, the matching rows are highlighted so you can read the relevant packets without scanning the whole capture.
Use hotspots to:
- Jump from a Stats finding to the bounded packet range behind it.
- Keep the current issue visible while scrolling through large captures.
- Open details for frame range, source, rule ID, context, and related signals when those fields are available.
Analyzer menus
The packet list has two important menus in the analyzer chrome:
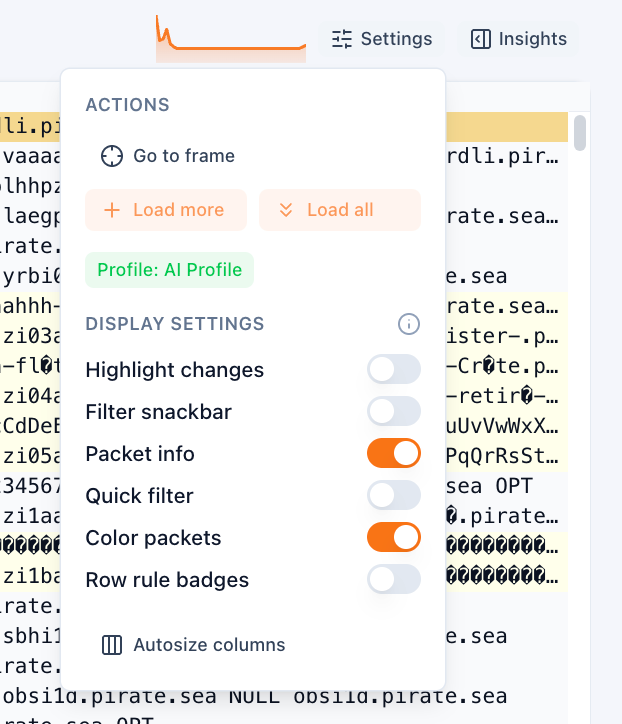
- Settings toggles inline list behavior such as packet info, quick filter chips, coloring, and autosizing.
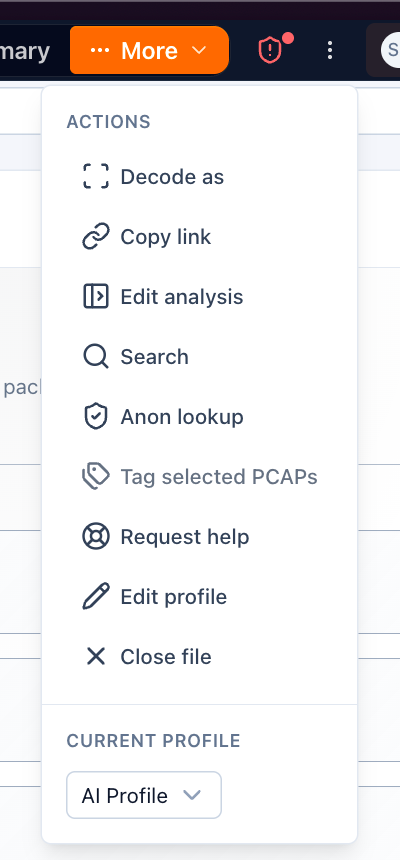
- More exposes actions such as Decode as, search, anon lookup, request help, and profile switching.
Right-click actions
Right-click a packet or column to:
- Prepare/apply filters based on a field value.
- Follow TCP/UDP streams or open the stream graph.
- Toggle time reference.
- Mark packets for export (“Save special packets”).
- Open Explain field for context and distributions.
Advanced rendering
Enable advanced rendering in your profile to visualize columns with flags, gradients, or relative markers (for example, longest frame). Configure which fields use which renderer in Settings → Profiles → Columns.